Diagramele Excel VBA
Diagramele pot fi denumite obiecte în VBA, similar cu foaia de lucru, putem insera diagrame și în VBA în același mod, mai întâi selectăm datele și tipul de diagramă pe care le dorim pentru date, acum există două tipuri diferite de diagrame pe care le oferim una este graficul încorporat în care graficul se află în aceeași foaie de date și un altul este cunoscut sub numele de foaia graficului în care graficul se află în foaia separată a datelor.
În analiza datelor, efectele vizuale sunt indicatorii cheie de performanță ai persoanei care a făcut analiza. Vizualele sunt cel mai bun mod posibil pe care un analist își poate transmite mesajul. Deoarece suntem cu toții utilizatori excel, de obicei petrecem o cantitate considerabilă de timp analizând datele și tragem concluzii cu numere și diagrame. Crearea unei diagrame este o artă de stăpânit și sper că aveți cunoștințe bune despre crearea de diagrame cu Excel. În acest articol, vă vom arăta cum să creați diagrame folosind codarea VBA.

Cum se adaugă diagrame folosind codul VBA în Excel?
# 1 - Creați diagramă utilizând codarea VBA
Pentru a crea orice diagramă, ar trebui să avem un fel de date numerice. Pentru acest exemplu, voi folosi eșantionul de mai jos.

Ok, să trecem la editorul VBA.
Pasul 1: Porniți procedura secundară.
Cod:
Sub Charts_Example1 () End Sub

Pasul 2: definiți variabila ca diagramă.
Cod:
Sub Charts_Example1 () Dim MyChart As Chart End Sub

Pasul 3: Deoarece diagrama este o variabilă obiect, trebuie să o setăm .
Cod:
Sub Charts_Example1 () Dim MyChart as Chart Set MyChart = Charts.Add End Sub

Codul de mai sus va adăuga o foaie nouă ca foaie de diagramă, nu ca foaie de lucru.

Pasul 4: Acum, trebuie să proiectăm graficul. Deschideți cu declarație.
Cod:
Sub Charts_Example1 () Dim MyChart as Chart Set MyChart = Charts.Add With MyChart End with End Sub

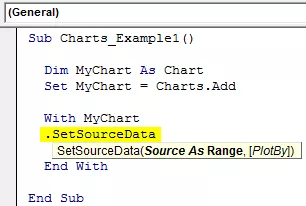
Pasul 5: Primul lucru cu graficul pe care trebuie să-l facem este să setăm intervalul sursă selectând metoda „Set Source Data” .
Cod:
Sub Charts_Example1 () Dim MyChart as Chart Set MyChart = Charts.Add With MyChart .SetSourceData End with End Sub
Pasul 6: Aici trebuie să menționăm intervalul sursă. În acest caz, intervalul meu de sursă se află în foaia numită „Sheet1”, iar intervalul este „A1 la B7”.
Cod:
Sub Charts_Example1 () Dim MyChart as Chart Set MyChart = Charts.Add With MyChart .SetSourceData Sheets ("Sheet1"). Range ("A1: B7") End with End Sub

Pasul 7: În continuare, trebuie să selectăm tipul de diagramă pe care urmează să o creăm. Pentru aceasta, trebuie să selectăm proprietatea Tip diagramă .
Cod:
Sub Charts_Example1 () Dim MyChart as Chart Set MyChart = Charts.Add With MyChart .SetSourceData Sheets ("Sheet1"). Range ("A1: B7") .ChartType = End With End Sub
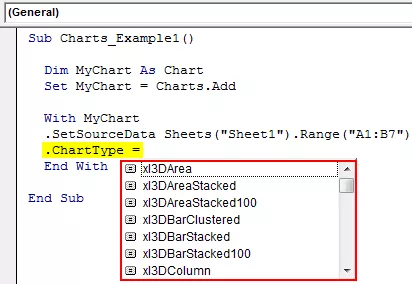
Pasul 8: Aici avem o varietate de diagrame. Voi selecta graficul „ xlColumnClustered ”.
Cod:
Sub Charts_Example1 () Dim MyChart as Chart Set MyChart = Charts.Add With MyChart .SetSourceData Sheets ("Sheet1"). Range ("A1: B7") .ChartType = xlColumnClustered End With End Sub

Ok, în acest moment, să rulăm codul folosind tasta F5 sau manual și să vedem cum arată graficul.

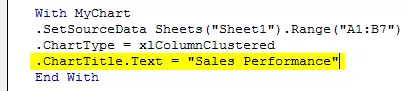
Pasul 9: Acum, modificați alte proprietăți ale graficului. Pentru a schimba titlul graficului, mai jos este codul.
Astfel, avem multe proprietăți și metode cu diagrame. Utilizați fiecare dintre ele pentru a vedea impactul și a învăța.
Sub Charts_Example1 () Dim MyChart as Chart Set MyChart = Charts.Add With MyChart .SetSourceData Sheets ("Sheet1"). Range ("A1: B7") .ChartType = xlColumnClustered .ChartTitle.Text = "Performance Performance" End With End Sub
# 2 - Creați o diagramă cu aceeași foaie Excel ca formă
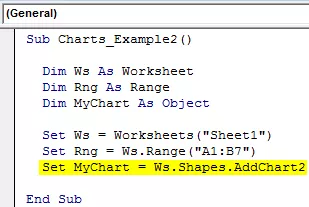
To create the chart with the same worksheet (datasheet) as shape, we need to use a different technique.
Step 1: First Declare threes Object Variables.
Code:
Sub Charts_Example2() Dim Ws As Worksheet Dim Rng As Range Dim MyChart As Object End Sub

Step 2: Then Set the Worksheet reference.
Code:
Sub Charts_Example2() Dim Ws As Worksheet Dim Rng As Range Dim MyChart As Object Set Ws = Worksheets("Sheet1") End Sub

Step 3: Now set the range object in VBA
Code:
Sub Charts_Example2() Dim Ws As Worksheet Dim Rng As Range Dim MyChart As Object Set Ws = Worksheets("Sheet1") Set Rng = Ws.Range("A1:B7") End Sub

Step 4: Now, set the chart object.
Code:
Sub Charts_Example2() Dim Ws As Worksheet Dim Rng As Range Dim MyChart As Object Set Ws = Worksheets("Sheet1") Set Rng = Ws.Range("A1:B7") Set MyChart = Ws.Shapes.AddChart2 End Sub
Step 5: Now, as usual, we can design the chart by using the “With” statement.

Code:
Sub Charts_Example2() Dim Ws As Worksheet 'To Hold Worksheet Reference Dim Rng As Range 'To Hold Range Reference in the Worksheet Dim MyChart As Object Set Ws = Worksheets("Sheet1") 'Now variable "Ws" is equal to the sheet "Sheet1" Set Rng = Ws.Range("A1:B7") 'Now variable "Rng" holds the range A1 to B7 in the sheet "Sheet1" Set MyChart = Ws.Shapes.AddChart2 'Chart will be added as Shape in the same worksheet With MyChart.Chart .SetSourceData Rng 'Since we already set the range of cells to be used for chart we have use RNG object here .ChartType = xlColumnClustered .ChartTitle.Text = "Sales Performance" End With End Sub
This will add the chart below.

#3 - Code to Loop through the Charts
Like how we look through sheets to change the name or insert values, hide & unhide them. Similarly, to loop through the charts, we need to use chart object property.
The below code will loop through all the charts in the worksheet.
Code:
Sub Chart_Loop() Dim MyChart As ChartObject For Each MyChart In ActiveSheet.ChartObjects 'Enter the code here Next MyChart End Sub
#4 - Alternative Method to Create Chart
We can use the below alternative method to create charts. We can use the Chart Object. Add method to create the chart below is the example code.
This will also create a chart like the previous method.
Code:
Sub Charts_Example3 () Dim Ws as Worksheet Dim Rng As Range Dim MyChart As ChartObject Set Ws = Worksheets ("Sheet1") Set Rng = Ws.Range ("A1: B7") Set MyChart = Ws.ChartObjects.Add (Left: = ActiveCell.Left, Width: = 400, Top: = ActiveCell.Top, Height: = 200) MyChart.Chart.SetSourceData Source: = Rng MyChart.Chart.ChartType = xlColumnStacked MyChart.Chart.ChartTitle.Text = "Performanță vânzări" End Sub


